
This page is about what happens to radar, ultrasonic, thickness, LiDAR and sonar data between the site and the report, and what the report contains.
From readings to findings
- Radar. Every scan is processed for the concrete's actual velocity, migrated, and read line by line; hyperbolae are picked, depths calculated and targets classified, with the confidence of each noted. Automated picking is used to speed the work, never to replace the reading.
- Ultrasonics and thickness. Pulse velocity and pulse echo results are checked against the calibration and the element geometry; thickness readings are set against nominal section and the loss and minimum calculated.
- Cover, carbonation and half-cell. Read together on the element drawing, so the zones at risk are ranked by the combination rather than by one reading.
- LiDAR, photogrammetry and sonar. Registered, checked for tolerance and used as the geometry the findings are placed on. See digital twin and 3D modelling.
- Repeat surveys. Compared on the same grid, so the report gives the change and the rate, not just the current state.
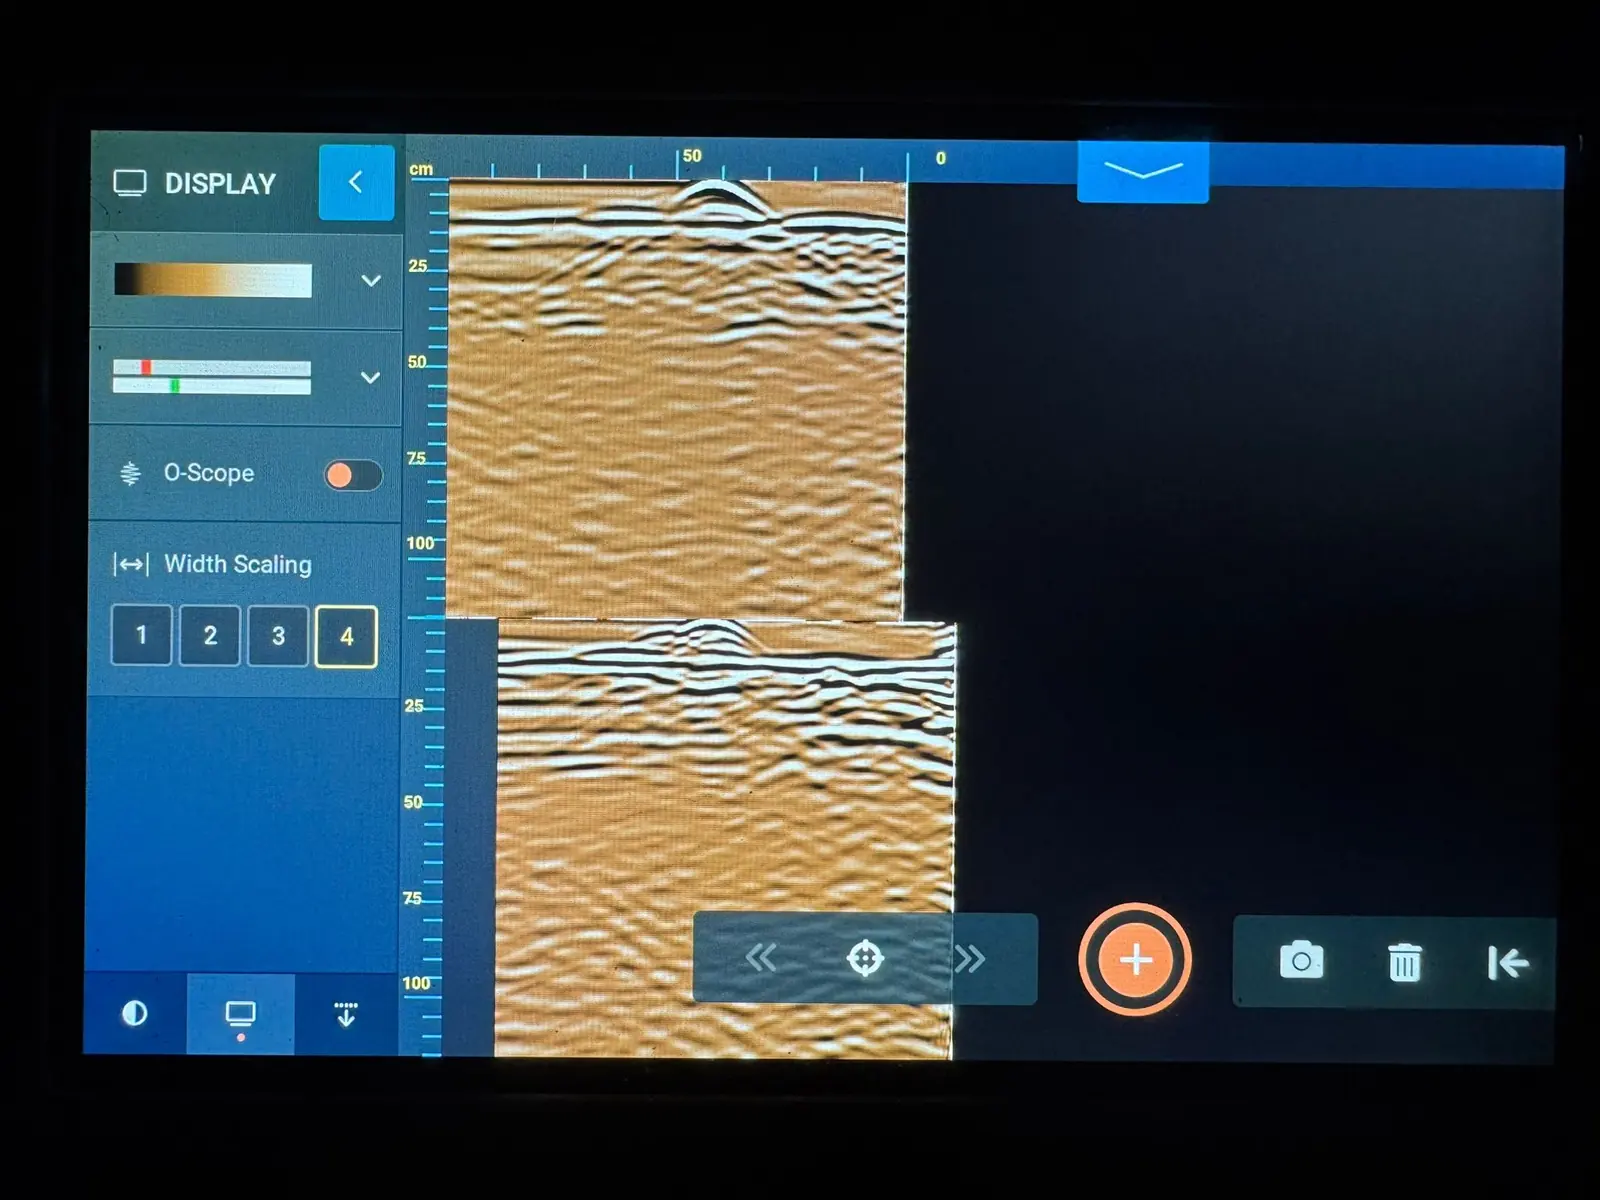
What every NDTScan report contains
- Scaled plans of every scanned, gauged or tested area with the findings drawn in, and photographs referenced to them.
- Tables of depth, cover, thickness, velocity or strength per area, with the tolerance that applied.
- The method, equipment, settings, calibration and the standard applied, so a second engineer can see how each reading was obtained.
- The confidence attached to each finding, and what it must not be relied on for.
- CAD overlays, point clouds and data files in the formats the engineer works in, where they were part of the scope.
- Where the engineer wants the surveyor's view, it is given as a view, with the evidence beside it. Repair design sits with the engineer.
The specialist who scanned the structure writes the report; no report is assembled by someone who never saw the site. It follows within an agreed number of working days.
What the report does not claim
A reading that the method could not support is reported as such, not rounded up to a finding. Radar does not give bar diameter; a rebound hammer alone does not give strength; sonar does not give crack width; a model measures to a tolerance. Reports that promise otherwise promise more than the instruments can give, and NDTScan's do not.
Working with your systems
Findings are delivered in the formats asset teams use: CAD overlays on the client's drawings, point clouds and meshes for BIM, tables for asset registers, and repeat-survey comparisons for integrity programmes. The service runs across all of NDTScan's survey work and is described alongside the equipment; NDTScan attends from Oxford anywhere in the UK, usually within one to two working days and same day where the diary allows.
Can you overlay findings on our drawings?
Yes. Send the drawings and the findings are placed on them, referenced to the element numbering used in the report.
Can you compare with a previous survey by someone else?
Where the previous grid and method are known, yes, with the comparison qualified by the differences. Where they are not, the new survey becomes the baseline for the next.
Questions we are asked
Do you use software to interpret the data automatically?
Software processes and picks; the specialist reads. Every finding in a report has been looked at by the person who scanned the element.